BY ALEXANDRE MACHADO
JULY 19, 2022
INTRAWEB GENERAL
Previously we have published a post showing how to detect - and fix - memory leaks in Delphi applications using FastMM, the standard memory manager for Delphi.
In this new post I'll bring another tool that can also detect memory leaks in Delphi applications, but not only that. The tool is named Deleaker: https://www.deleaker.com
Artem Razim, Deleaker author, granted us a free license so we could properly test Deleaker with IntraWeb applications. Deleaker allows you to test it for 14 days using a trial key that should be requested on their web site.
Deleaker is a full profiler for Delphi/C++ and also .NET applications. It allows users to detect leaks caused by memory allocations in the Delphi memory manager itself (similarly to the feature found in FastMM) but also leaks of other types of resources which are unknown to the memory manager being used (e.g. a file handle) . These leaks are really hard to spot and in general require specialized tools.
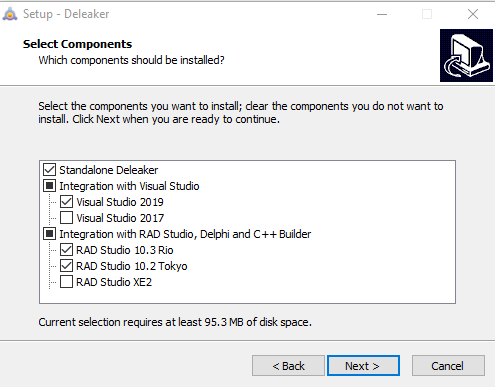
Contrary to FastMM - which is basically a unit linked to your application - Deleaker is a full stand alone application which also can be integrated with Delphi/RAD Studio IDE (and also Visual Studio). You can choose the integration option during the installation. I decided to have it integrated with my RAD Studio IDE, which I recommend:
After installing it, you will find a new menu named Deleaker, next to the Run menu item:
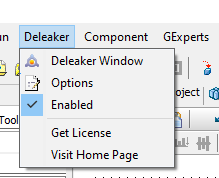
By default it is always Enabled, meaning that it will profile and analyze your application execution every time. Probably it's better to disable it for normal development/debugging and only enable it when searching for memory leaks. As I mentioned in the other post, developers should test their applications for memory leaks from time to time. Making it part of the normal development cycle is ideal.
When running your Delphi application from within the IDE, the best way to interact with Deleaker is via the Deleaker menu item. Click on the "Deleaker Window" item and it will bring the main program window to the foreground:

Now we can explore some unique Deleaker features"¦ Deleaker has a special feature named "Snapshots". It basically grabs all information about the memory and resource allocation state at the exact moment when the snapshot was taken, and saves it. The snapshot can be then inspected and also compared to other snapshots (e.g. when you want to investigate the increase in memory consumption when you execute some method in your application).
Let's take a couple of snapshots. Just click on "Take Snapshot" button and a new snapshot will be created:

Here's where the fun begins. As you can see, among the tabs we can find two that give us some very interesting information: Allocations and Delphi Objects.
Switching to Delphi Objects tab we can see all Delphi objects created (and still "alive"):
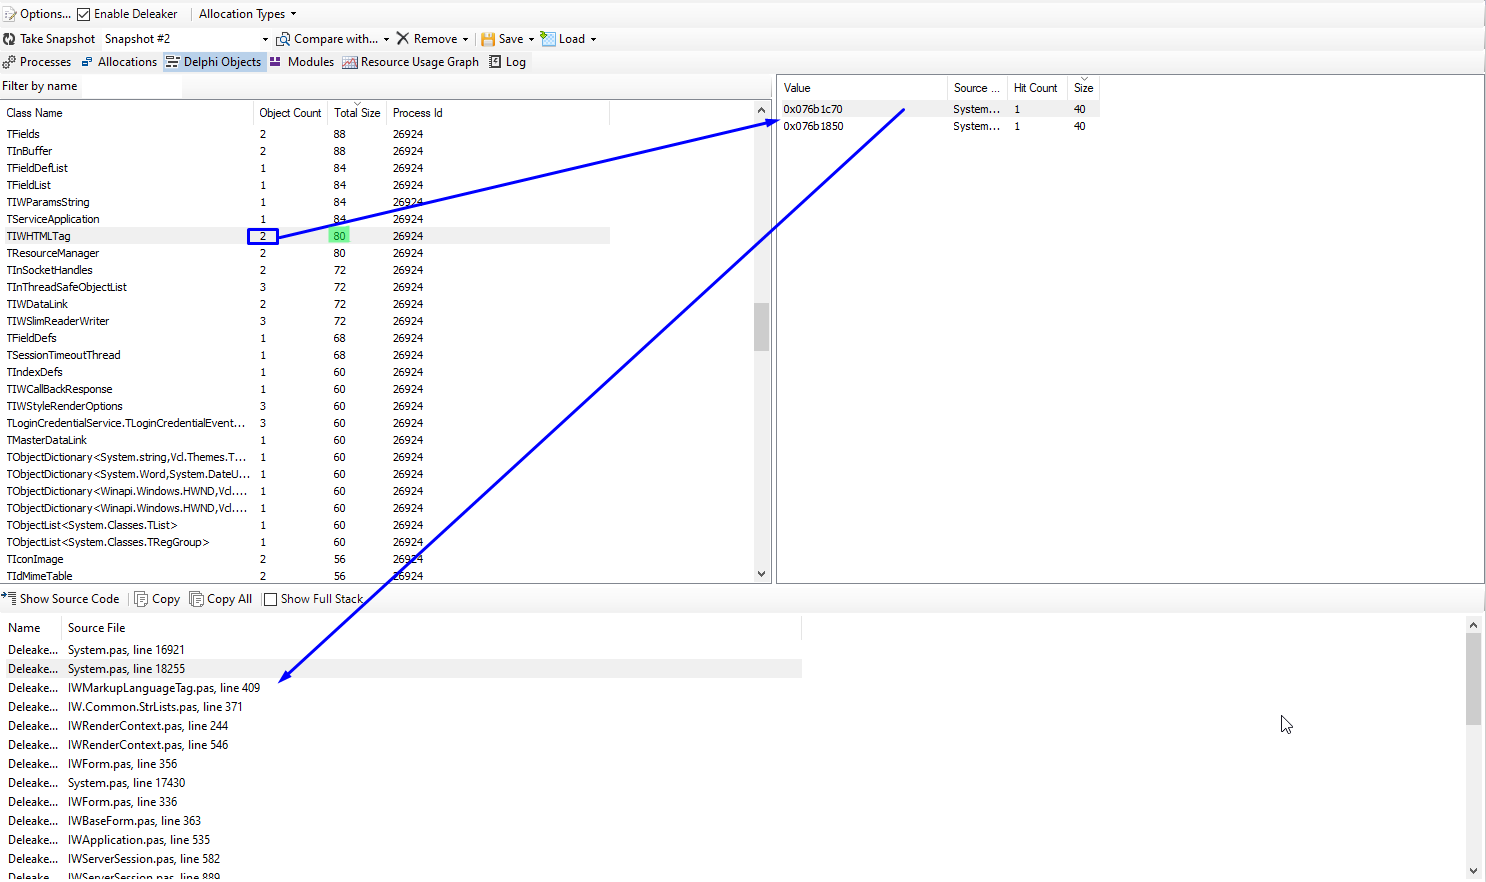
On the top pane we have a list of all objects created, the number of instances created and the total memory size in bytes of those instances. On the right panel we have one line for each of the instances created. Selecting any of those lines we have, in the bottom panel, the call stack, i.e. the reference of the code that created that object. In my example I have 2 instances of TIWHTMLTag class, using 80 bytes of RAM and both created in IWMarkupLanguageTag.pas unit, in line 409. Cool isn't it? Using simple visual inspection it is possible to find unusual memory consumption and some other application problems (e.g. an abnormal number of active instances of of some class).
I created a sample application that can be also found in our Github repository that shows how efficient it can be to track down memory and resource leaks.
The source code can be found here: https://github.com/Atozed/IntraWeb/tree/master/15/Delphi/DeleakerDemoProject
There are 2 main leaks: A file handle leak (that can't be detected via memory manager tools) and a whole DataModule instance, which causes the leakage of hundreds of other objects. Let's see how to fix this using Deleaker.
All I had to do to find out about these leaks was executing the application. When closing it, if Deleaker is enabled, it will automatically inspect the process to detect leaks. Here's the final result:
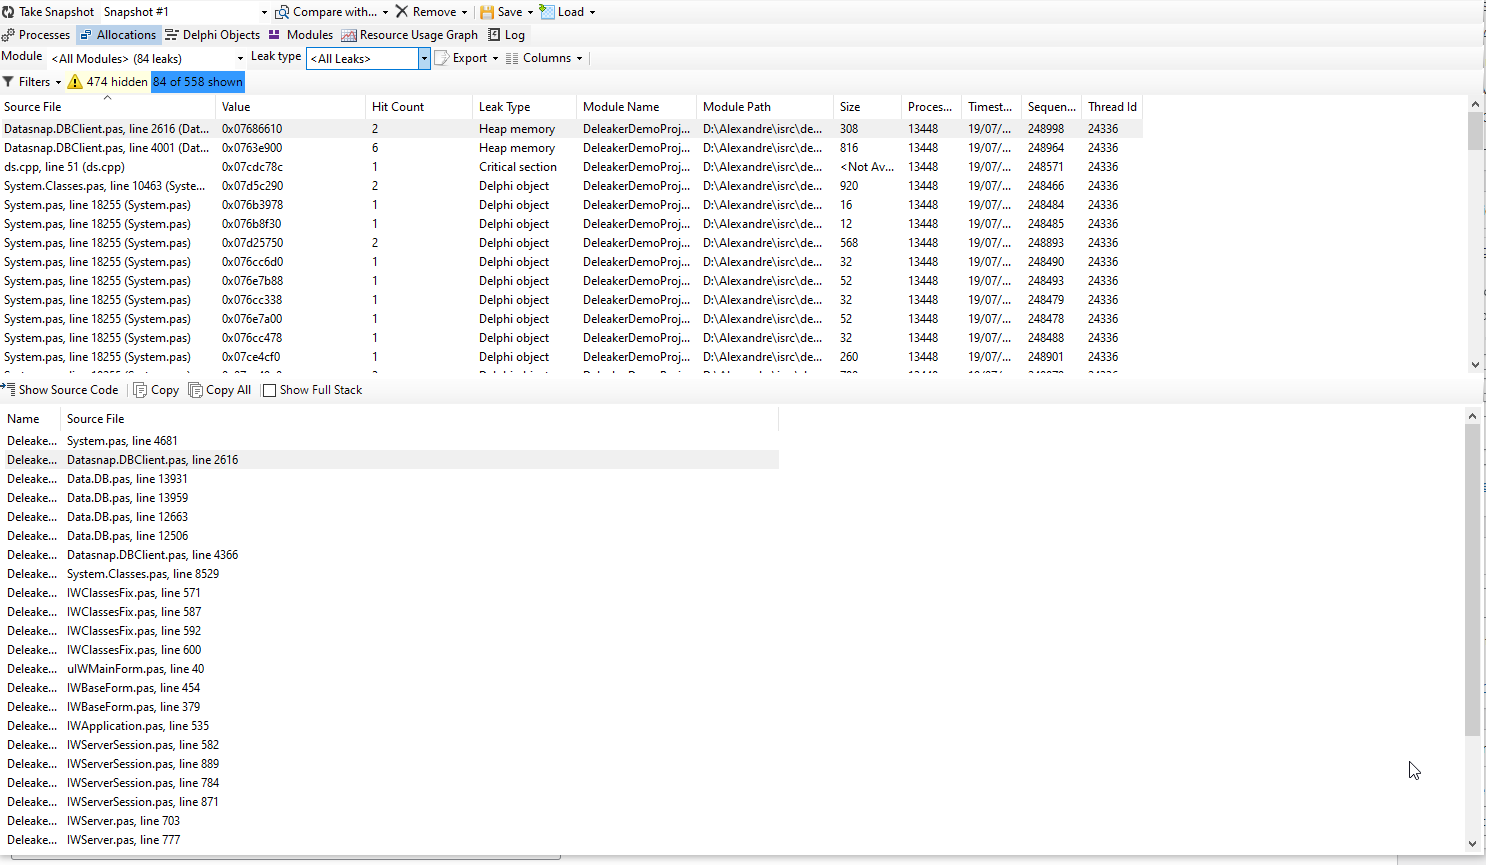
As you can see, there is an enormous number of leaks and the list looks infinite. Seems like the application is totally FUBARed!
Don't panic! It is indeed simple to find out what's causing all those leaks. First let's inspect the leaks by type. We can see that we have various types of leaks, including memory leaks and also a handle leak. Let's start with the handle leak:
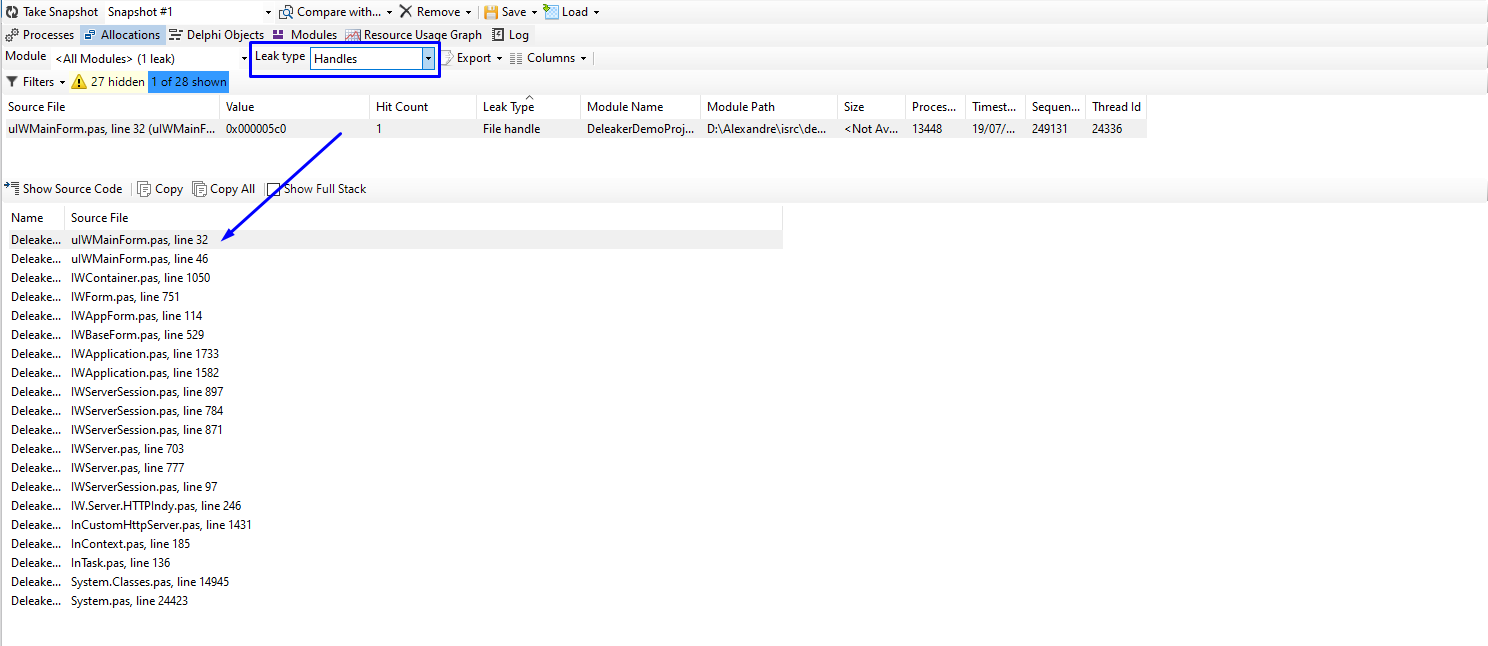
Selecting it from the top panel, we can see the call stack right below. As I mentioned in the FastMM post, when investigating memory leaks using a call stack, always start from top to bottom, looking into code that belongs to your application first, ignoring for now anything that is not your own code. In this specific case, I can see that the first line in the call stack is my own unit, uIWMainForm.pas, where my application's main form is declared. It points to line 32. Let's see what's in there:
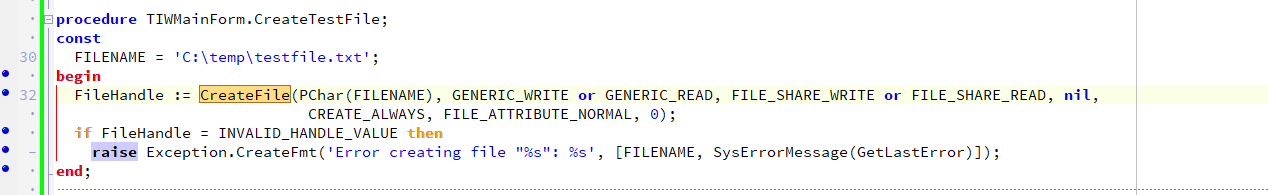
Bingo! In line 32 we create a file via Windows API CreateFile() call. The file handle is kept in FileHandle field but the file is never closed (thus the handle is never released). This is a serious problem in any application and it's very hard to find via normal investigation methods. In order to fix it I just need to call CloseHandle() at a later time.
Now, let's continue our investigation, moving to the next in line, a real memory leak. As we can see here:
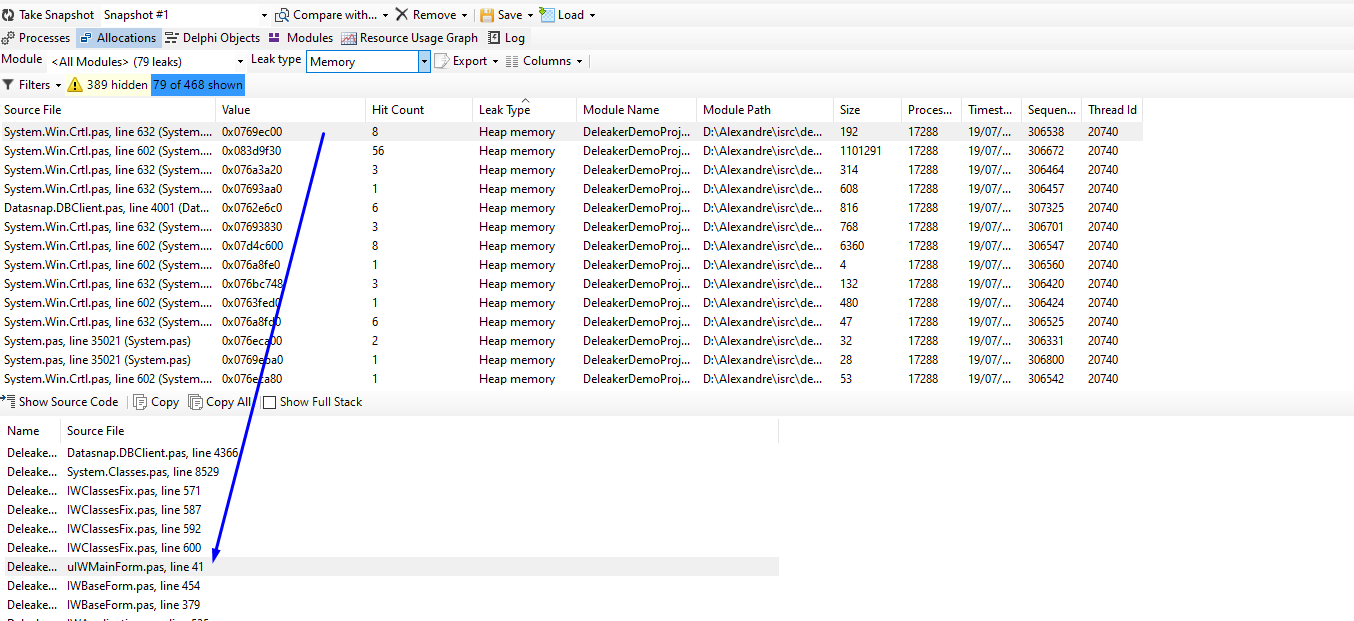
Again, ignoring anything that is not our own code, we find a reference to uIWMainForm.pas, line 41, which gives us this:
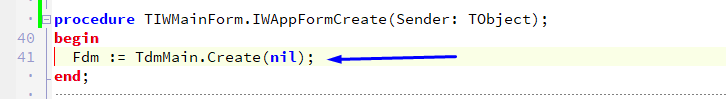
Right on target again. In this case we are creating a new TDataModule instance which contains a ClientDataSet (with many fields) and also a TDataSource. This is probably the cause of all those leaks in the list. A TDataModule or a TIWForm alone will be responsible for dozens if not hundreds of other minor leaks in the final Deleaker report.
In this case, the best way to fix it is just letting the IWForm be the owner of the DataModule, and handle its destruction later.
After fixing this, all other leaks caused by our application will be resolved.
Deleaker proved to be a valuable tool for any developer. Not only it can detect real problems like memory leaks but it can also help you to investigate the memory consumption of your application over time using other features that I didn't cover here (maybe a future blog post).